[study] Visualization
Several seaborn libraries to visualize data in virtual environment.
Visualization
Univariate vs. Multivariate
Univariate : when analyzing a single variable
Multivariate : when analyzing more than two variables
Prerequisites
Matplotlib and Seaborn are the commonly used libraries to visualize given data.
import these libraries and install them if not installed.
# !pip install matplotlib
# !pip install seaborn

import numpy as np
import pandas as pd
import matplotlib as mpl
import matplotlib.pyplot as plt
import seaborn as sns

%matplotlib inline
Import dataset used for visualization process.
flights = pd.read_csv('flights.csv')
hotels = pd.read_csv('hotels.csv')
Countplot
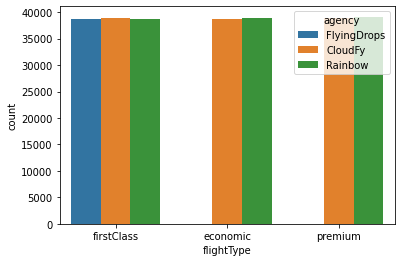
Countplot (barplot) expresses the frequency of unique word counts in the data.
Countplot can be visualized on the virtual environment using seabron countplot function.
# hue: set variable used to encode colors
sns.countplot(data = flights, x = 'flightType', hue = 'agency')
plt.show()
Histogram
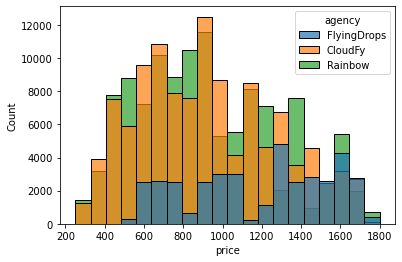
Histogram represents the distribution of the data at the given range. Histogram can be visualized using seaborn histplot function.
# bins: # of bin
# binrange: range of data
# hue: when considering multiple variables

sns.histplot(data = flights, x = 'price', bins = 20,
             binrange = (0, 1800), hue = 'agency')
plt.show()
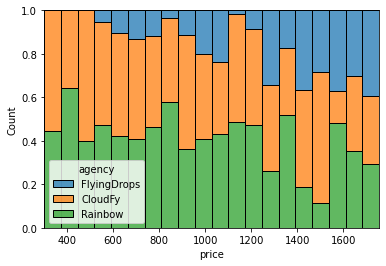
# multiple: Strong visualization tool on bi-variate data
#('layer', 'dodge', 'stack', 'fill')
sns.histplot(data = flights, x = 'price', bins = 20,
             hue = 'agency', multiple = 'fill')
plt.show()
Barplot
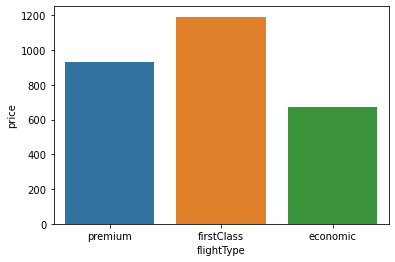
Barplot expresses numerical data based on each categories.
# estimator: applies statistical method on y variable
# ('np.mean', 'np.median', 'np.sum'...)
sns.barplot(data = flights, x = 'flightType', y = 'price',
            estimator = np.median,
            order = ['premium', 'firstClass', 'economic'])
plt.show()
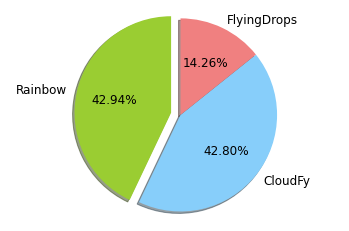
Piechart
Piechart slices and visualizes data into numerical percentage value.
# value_count on 'agency' variable
ag_count = flights['agency'].value_counts()

sizes = [ag_count[0], ag_count[1], ag_count[2]]
labels = ['Rainbow', 'CloudFy', 'FlyingDrops']
colors = ['yellowgreen', 'lightskyblue', 'lightcoral']
# distance each pie segment
explodes = (0.1, 0, 0)

plt.pie(sizes,
        labels = labels,
        colors = colors,
        explode = explodes,
        # express percentage value to each pie segment
        autopct = "%1.2f%%",
        shadow = True,
        # start angle
        startangle = 90,
        textprops = {'fontsize':12})

plt.axis('equal')
plt.show()
Scatterplot
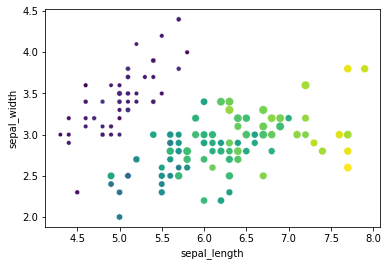
Scatterplot visualizes the relationship between two numerical variables.
# hue: encode color by given variable
# size: encode size by given variable
# legend: if False -> remove legend

sns.scatterplot(data = iris, x = 'sepal_length', y = 'sepal_width',
                hue = 'petal_length', size = 'petal_width',
                palette = 'viridis', legend = False)
plt.show()
Trendline
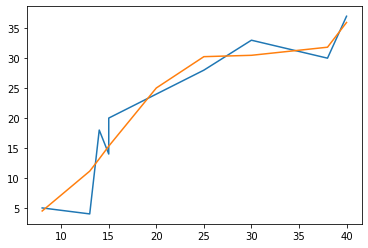
‘numpy polyfit’ function returns one dimensional array of coefficients of a given data.
It can be used with ‘numpy poly1d’ funtion to express values on a 2-D graph.
x = np.array([8, 13, 14, 15, 15, 20, 25, 30, 38, 40])
y = np.array([5, 4, 18, 14, 20, 24, 28, 33, 30, 37])

z = np.polyfit(x, y, 4)
p = np.poly1d(z)

plt.plot(x, y)
plt.plot(x, p(x))
plt.show()
Extras
1. Set graph size
plt.figure(figsize = (width, height))
2. Set xy-ticks variable
# rotation: rotate ticks x-degrees
# fontsize: fontsize
plt.xticks(x_data, ['a', 'b', ...], rotation = 30, fontsize = 12)
plt.yticks(y_data)
3. xy min-max value
# [xmin, xmax, ymin, ymax]
plt.axis([0, 10, 5, 15])
4. tick_params
# axis = {'x', 'y', 'both'}
# direction = {'in', 'out', 'inout'}
# length = define length of ticks
# labelsize = define label font size
# labelcolor = define label font color
# width = define ticks width
# color = define ticks color
plt.tick_params(axis = 'x', direction = 'out', length = 5,
                pad = 3, labelsize = 10, labelcolor = 'green')
5. figure and subplots
fig, axes = plt.subplots(2, 2, figsize = (15, 8))

axes[0,0].plot(df.index, df.a, marker = 's', color = 'red', label = 'a')
axes[0,1].plot(df.index, df.b, marker = 'd', color = 'blue', label = 'b')
axes[1,0].plot(df.index, df.c, marker = '*', color = 'springgreen', label = 'c')
axes[1,1].plot(df.index, df.d, marker = '+', color = 'yellow', label = 'd')

plt.show()
6. save figure
fig.savefig('df1_visualization.png')
7. palette
palette = sns.color_palette("Set3")
sns.set_palette("Set3")

댓글남기기