[study] EDA methodologies
EDA procedures, types, and exercises.
What is Exploratory Data Analysis (EDA)?
Exploratory Data Analysis is the process of analyzing and summarizing a dataset in order to understand its overall structure, patterns, and relationships. EDA pioneers any data analysis project, and is often used to help formulate hypotheses and identify areas of interest for further investigation.
Data Analysis Procedures
- Define Problems
- Understand target, define target objectively.
- Collect Data
- Organize necessary data, identify and secure data location.
- Data Analysis
- Check for errors, improve data structure and features
- Data Modeling
- Design data from various views, establish relationships between relative tables
- Visualization and Re-exploration
- Derive insights to address various types of problem
Exploratory Data Analysis Procedures
- Collect Data
- Create data collection pipeline, organize required data.
- Data Preprocessing
- Handle missing data, explore outliers, data labeling…
- Data Scaling
- Normalize/Standardize data, adjust volume (oversampling/undersampling)
- Data Visualization
- Data Visualization (Modeling)
- Post processing
- Explore outliers, Fine Tuning
Exercise
Examples of basic EDA methods
train = pd.read_csv('train.csv')
test = pd.read_csv('test.csv')
Interpolation
Interpolate missing values using various indicators from the dataframe.
# Interpolate missing values via median
df_train = df_train.fillna(df_train.median())
df_test = df_test.fillna(df_test.median())
Encode string values into int / float scalar to faciliate input selection.
# Interpolate missing values via median
from sklearn.preprocessing import LabelEncoder
enc = LabelEncoder()
enc.fit(train['Sex'])
labels_1 = enc.transform(train['Sex'])
labels_2 = enc.transform(test['Sex'])
train['l_sex'] = labels_1
test['l_sex'] = labels_2
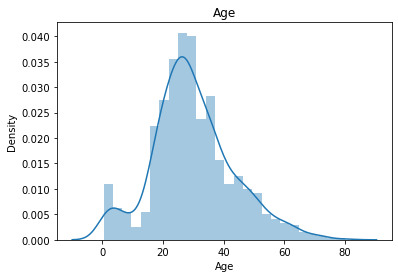
Histogram, QQplot
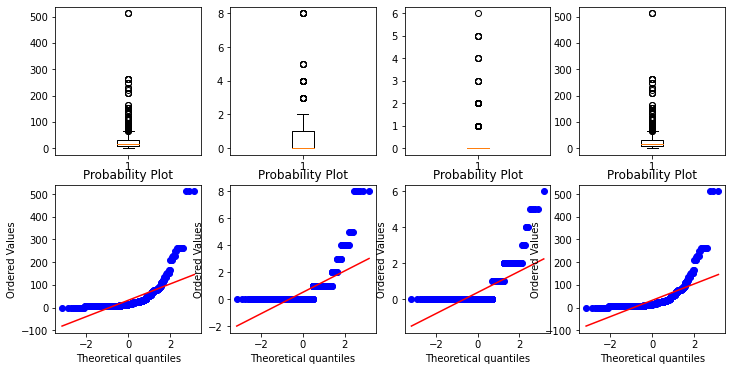
Visualize univariate data into histograms and QQplots.
import scipy.stats as stats
for col in numeric_f:
    sns.distplot(filled_train.loc[filled_train[col].notnull(), col])
    plt.title(col)
    plt.show()

from scipy.stats import probplot #for qq plot
f, axes = plt.subplots(2, 4, figsize=(12, 6))
Age = np.array(filled_train['Age'])
Sib = np.array(filled_train['SibSp'])
Par = np.array(filled_train['Parch'])
Age = np.array(filled_train['Fare'])
axes[0][0].boxplot(Age)
probplot(Age, plot=axes[1][0]) #scipy.stats.probplot
axes[0][1].boxplot(Sib)
probplot(Sib, plot=axes[1][1]) #scipy.stats.probplot
axes[0][2].boxplot(Par)
probplot(Par, plot=axes[1][2])
axes[0][3].boxplot(Age)
probplot(Age, plot=axes[1][3]) #scipy.stats.probplot
plt.show()

Cross Tabulation
Analyze multivariate data using pandas crosstab library.
pd.crosstab(filled_train['Sex'], filled_train['Pclass'],
            normalize = 'index', margins = True)
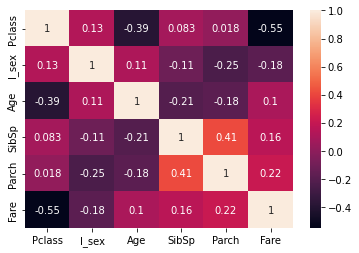
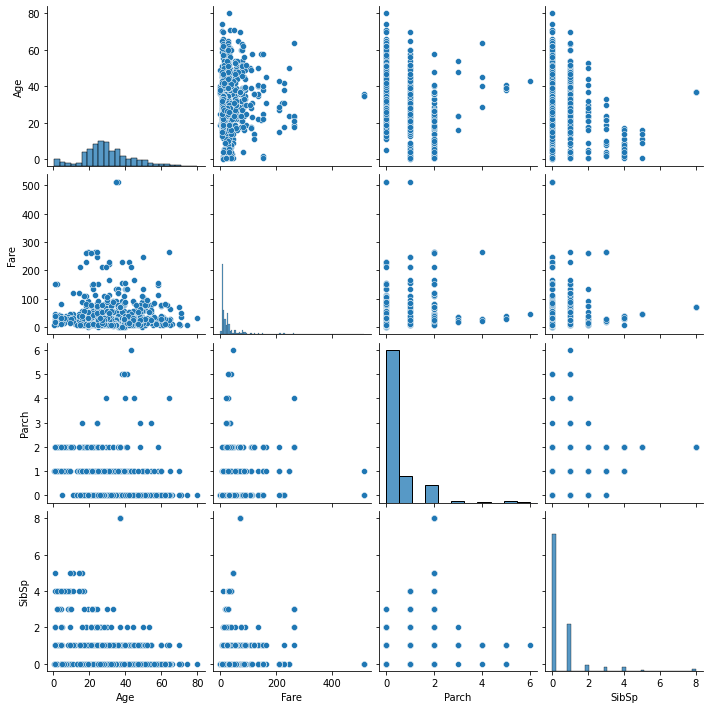
Scatterplots & Heatmap
Visualize multivariate data using scatterplots and heatmap.
import seaborn as sns
sns.heatmap(df_corr, annot=True)
plt.show()

sns.pairplot(filled_train[list(numeric_f)],
             x_vars=numeric_f, y_vars=numeric_f)
plt.show()


댓글남기기