[projects] EDA_analysis
EDA 발표 (01.25) 이전 데이터분석 (1)
Preprocessing
import numpy as np
import pandas as pd
import matplotlib.pyplot as plt
import seaborn as sns
import warnings
from datetime import datetime
warnings.filterwarnings(action='ignore')

plt.rcParams['font.family'] = 'NanumGothic'

#시각화 색상 통일

col=['#6B4E24','#EECA98','#EBAA4F','#6B5B45','#B8853E','#AB891A','#6B5610','#EBBC23','#F7B50F']

df = pd.read_csv('mapo_2019.csv')

# 시간데이터 datetime으로 변환
df['측정일시'] = df.apply(lambda row: datetime.strptime(str(row['측정일시']), '%Y-%m-%d %H:%M:%S'), axis = 1)
1. 시간별 데이터셋
df_t = df.copy()
df_t['time'] = df_t.apply(lambda row: row['측정일시'].strftime('%H'), axis = 1)

gr_t = df_t.groupby(['time'], as_index=False).agg({'dust':'mean', 'f_dust':'mean',
                                                          'oz':'mean', 'no2':'mean'})
# 측정시간에 따른 대기오염도 농도의 평균

fig, axes = plt.subplots(2,1, figsize=(10, 12))

sns.lineplot(ax = axes[0], data = gr_t, x = gr_t['time'],
             y = gr_t['dust'], marker = 'o', palette = col, label = '미세먼지')
sns.lineplot(ax = axes[0], data = gr_t, x = gr_t['time'],
             y = gr_t['f_dust'], marker = 'o', palette = col, label = '초미세먼지')
axes[0].axvline(x = 11, color = 'r', linewidth = 3)

sns.lineplot(ax = axes[1], data = gr_t, x = gr_t['time'],
             y = gr_t['oz'], marker = 'o', palette = col, label = '오존')
sns.lineplot(ax = axes[1], data = gr_t, x = gr_t['time'],
             y = gr_t['no2'], marker = 'o', palette = col, label = '이산화질소')

for i,ax in enumerate(axes.reshape(-1)):

    ax.set_facecolor('white')
    ax.grid(b = True, color='#999999')

fig.suptitle('측정시간에 따른 대기오염도 농도의 평균', size = 25)
plt.legend()
plt.show()
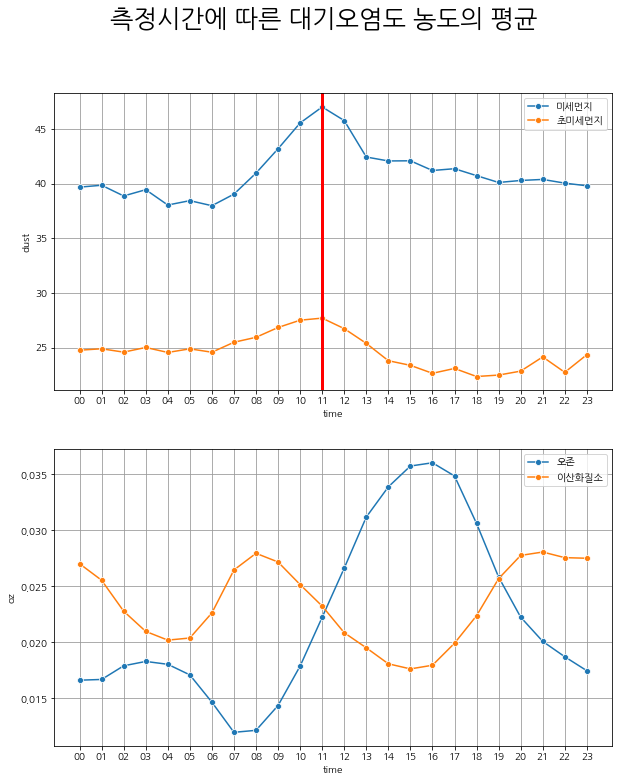
미세먼지와 초미세먼지는 11시를 기점으로 오전시간대 (오전 0시 - 8시), 오후시간대 (오후 2시 - 10시)의 시간별 대기오염농도가 대칭되는 분포를 가진다. 오존과 이산화질소는 서로 반비례관계에 있는 시간별 대기오염농도 분포를 가진다.
f, ax = plt.subplots(3, 2, figsize=(15,12))

sns.regplot(x = 'dust', y = 'f_dust', data = gr_t, ax = ax[0,0]).set_title('미세먼지 - 초미세먼지', size = 20)
sns.regplot(x = 'dust', y = 'oz', data = gr_t, ax = ax[0,1]).set_title('미세먼지 - 오존', size = 20)
sns.regplot(x = 'dust', y = 'no2', data = gr_t, ax = ax[1,0]).set_title('미세먼지 - 이산화질소', size = 20)
sns.regplot(x = 'f_dust', y = 'oz', data = gr_t, ax = ax[1,1]).set_title('초미세먼지 - 오존', size = 20)
sns.regplot(x = 'f_dust', y = 'no2', data = gr_t, ax = ax[2,0]).set_title('초미세먼지 - 이산화질소', size = 20)
sns.regplot(x = 'oz', y = 'no2', data = gr_t, ax = ax[2,1]).set_title('오존 - 이산화질소', size = 20)

plt.subplots_adjust(left=0.125, bottom=0.1,  right=0.9, top=0.9, wspace=0.2, hspace=0.35)
plt.show()
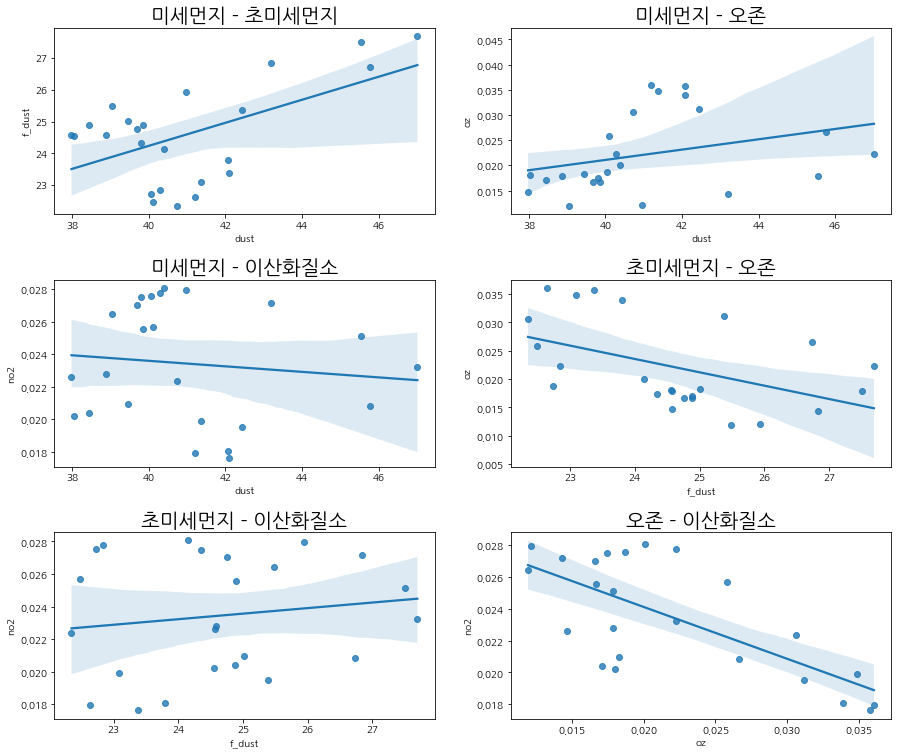
미세먼지와 초미세먼지, 그리고 오존과 이산화질소는 상관관계가 있음을 확인 가능합니다.
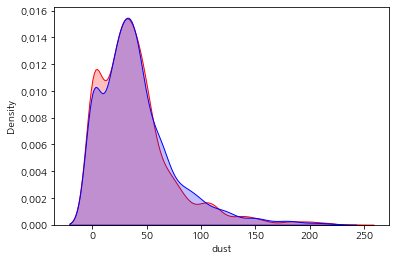
T-test 1. 시간별 대기오염농도 분포 T-test: 오전 11시를 기점으로 오전시간대와 오후시간대 대기오염농도가 대칭되는 분포를 가지는 데, 각 날짜마다 존재하는 오차일 뿐이지 전체적인 평균은 같을 것이다.
$H_0 : \overline{X_a} = \overline{X_b}$
$H_1 : \overline{X_a} \ne \overline{X_b}$
# 오전시간대 미세먼지, 초미세먼지 농도
mor = df_t[(df_t['time'].astype('int') >= 0) & (df_t['time'].astype('int') <= 8)].reset_index()
# 오후시간대 미세먼지, 초미세먼지 농도
sw = df_t[(df_t['time'].astype('int') >= 14) & (df_t['time'].astype('int') <= 22)].reset_index()
sns.kdeplot(data = mor['dust'], color="red", shade=True)
sns.kdeplot(data = sw['dust'], color="blue", shade=True)
plt.show()
from scipy import stats

# 미세먼지 농도 t-test
t_stat, p_value = stats.ttest_ind(mor['dust'], sw['dust'],
                                  equal_var=True, alternative="two-sided")

print("t-statistics : {}, p-value : {}".format(round(t_stat, 4), round(p_value, 4)))

# 초미세먼지 농도 t-test
t_stat, p_value = stats.ttest_ind(mor['f_dust'], sw['f_dust'],
                                  equal_var=True, alternative="two-sided")

print("t-statistics : {}, p-value : {}".format(round(t_stat, 4), round(p_value, 4)))
t-statistics : -2.0247, p-value : 0.0429
t-statistics : 3.4273, p-value : 0.0006 미세먼지 p-value : 0.0429 < 0.05 -> 오전시간대와 오후시간대 미세먼지 농도 평균은 다르다.
초미세먼지 p-value : 0.0006 < 0.05 -> 오전시간대와 오후시간대 초미세먼지 농도 평균은 다르다.
–> 미세먼지는 오후시간대, 초미세먼지는 오전시간대 농도 평균이 높음을 확인할 수 있음.
2. 월별 데이터셋
df_m = df.copy()
df_m['month'] = df_t.apply(lambda row: row['측정일시'].strftime('%m'), axis = 1)

gr_m = df_m.groupby(['month'], as_index=False).agg({'dust':'mean', 'f_dust':'mean',
                                                          'oz':'mean', 'no2':'mean'})
# 측정월에 따른 대기오염도 농도의 평균

fig, axes = plt.subplots(2,1, figsize=(10, 12))

sns.lineplot(ax = axes[0], data = gr_m, x = gr_m['month'],
             y = gr_m['dust'], marker = 'o', palette = col, label = '미세먼지')
sns.lineplot(ax = axes[0], data = gr_m, x = gr_m['month'],
             y = gr_m['f_dust'], marker = 'o', palette = col, label = '초미세먼지')

sns.lineplot(ax = axes[1], data = gr_m, x = gr_m['month'],
             y = gr_m['oz'], marker = 'o', palette = col, label = '오존')
sns.lineplot(ax = axes[1], data = gr_m, x = gr_m['month'],
             y = gr_m['no2'], marker = 'o', palette = col, label = '이산화질소')

for i,ax in enumerate(axes.reshape(-1)):

    ax.set_facecolor('white')
    ax.grid(b = True, color='#999999')

fig.suptitle('측정월에 따른 대기오염도 농도의 평균', size = 25)
plt.legend()
plt.show()
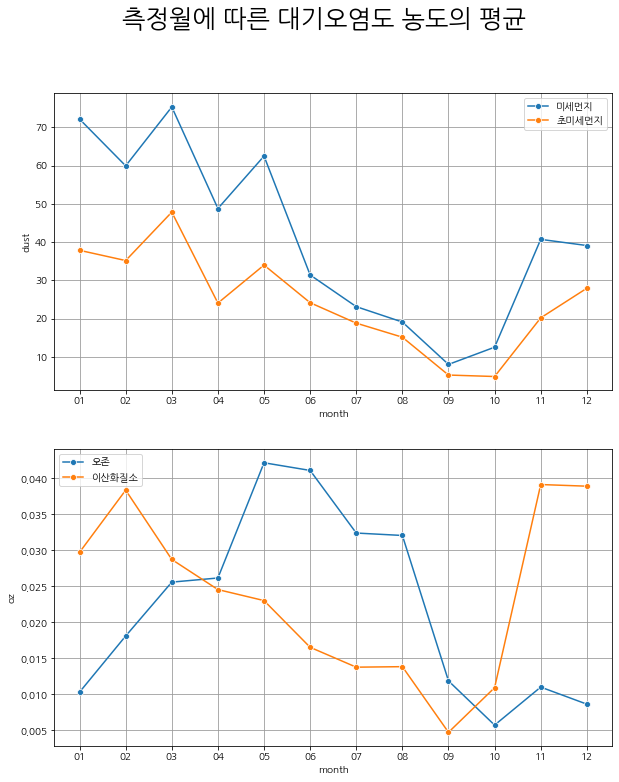
미세먼지와 초미세먼지는 연초에 농도가 높고 9월즈음에 최저치를 찍음. 오존과 이산화질소는 각각 여름과 겨울에 최고치를 찍는 음의 상관관계를 보임.
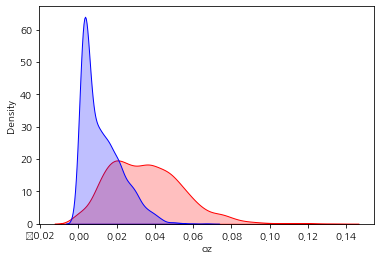
2. T-test -> 오존의 계절성: 오존 여름 평균 (6-8월)과 겨울 평균(12-2월) 평균 차이 비교
$H_0 : \overline{X_a} = \overline{X_b}$
$H_1 : \overline{X_a} \ne \overline{X_b}$
# 오전시간대 미세먼지, 초미세먼지 농도
summer = df_m[(df_m['month'].astype('int') >= 6) & (df_m['month'].astype('int') <= 8)].reset_index()
# 오후시간대 미세먼지, 초미세먼지 농도
winter = df_m[(df_m['month'].astype('int') >= 12) | (df_m['month'].astype('int') <= 2)].reset_index()
sns.kdeplot(data = summer['oz'], color="red", shade=True)
sns.kdeplot(data = winter['oz'], color="blue", shade=True)
plt.show()
from scipy import stats

# 오존 농도 t-test
t_stat, p_value = stats.ttest_ind(summer['oz'], winter['oz'],
                                  equal_var=True, alternative="two-sided")

print("t-statistics : {}, p-value : {}".format(round(t_stat, 4), round(p_value, 4)))
t-statistics : 48.386, p-value : 0.0
오존 p-value : 0.0000 < 0.05 -> 여름 > 겨울 오존 농도
–> 오존은 겨울보다 여름에 농도가 높은 계절성을 보인다

댓글남기기